2023-09-13 Stat Cafe - Dr. Suhasini Subba Rao
- Time: Wednesday 09/13/2023 from 11:30 AM to 12:20 PM
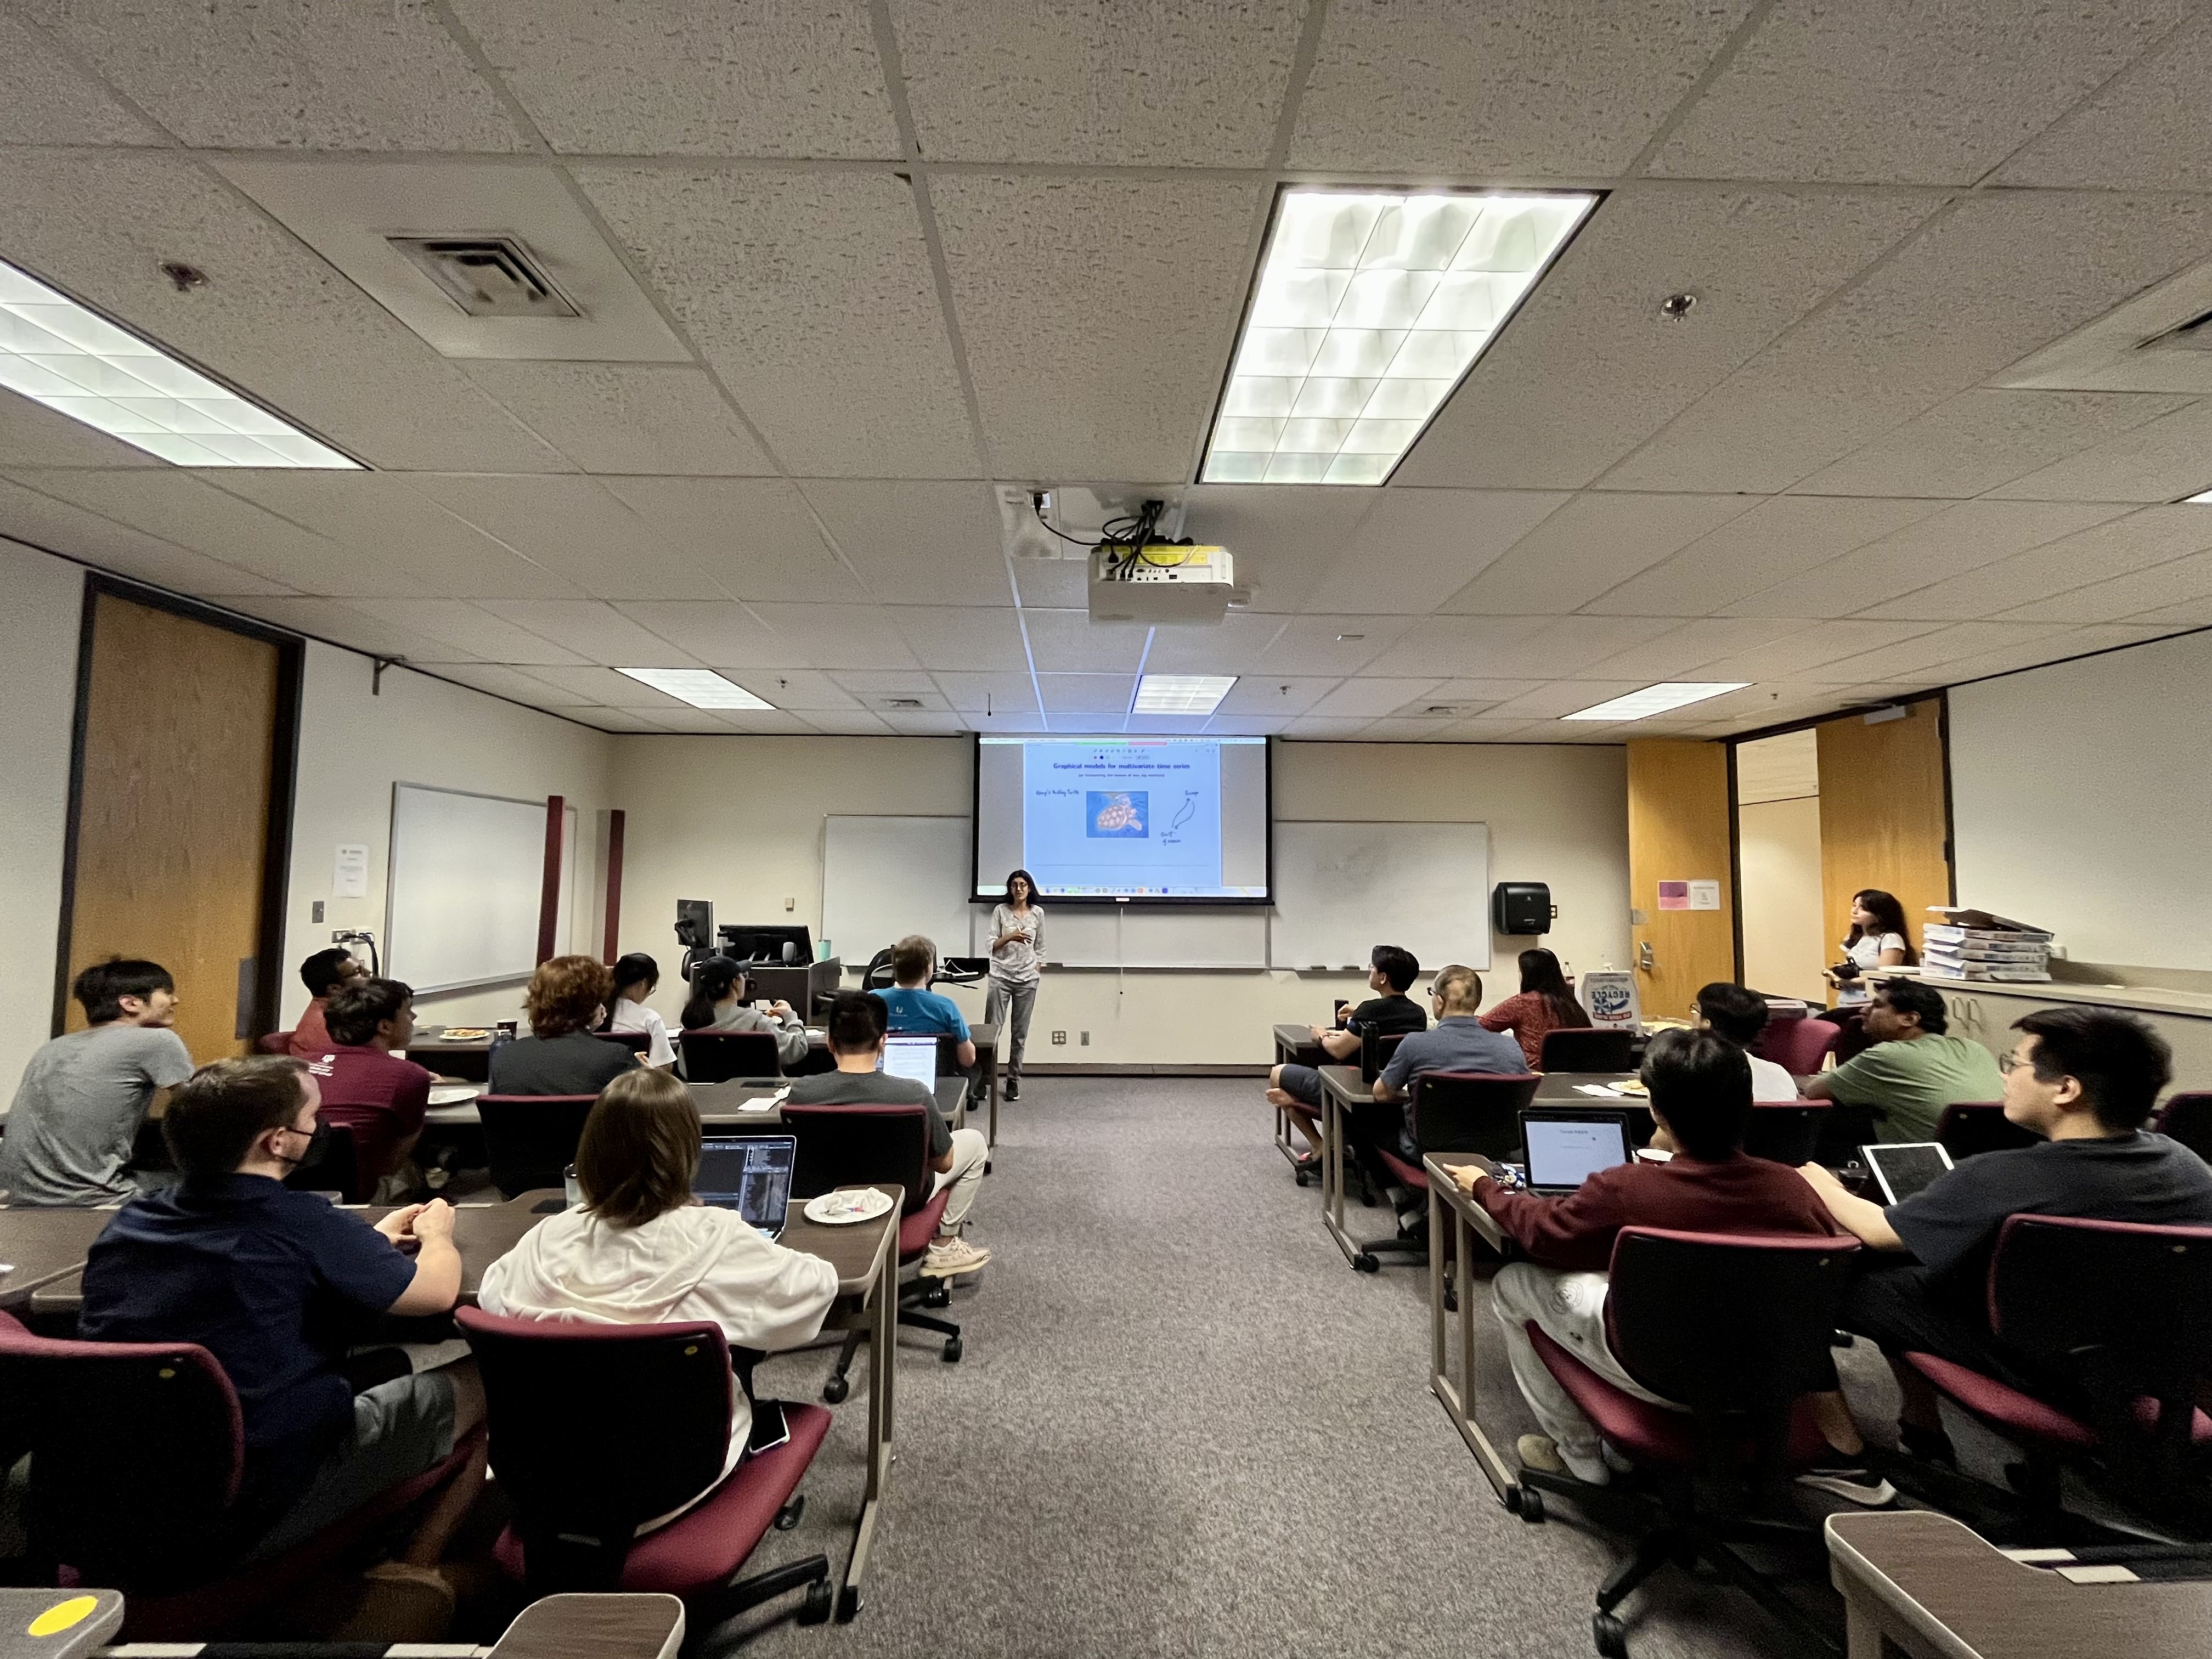
- Location: BLOC 448
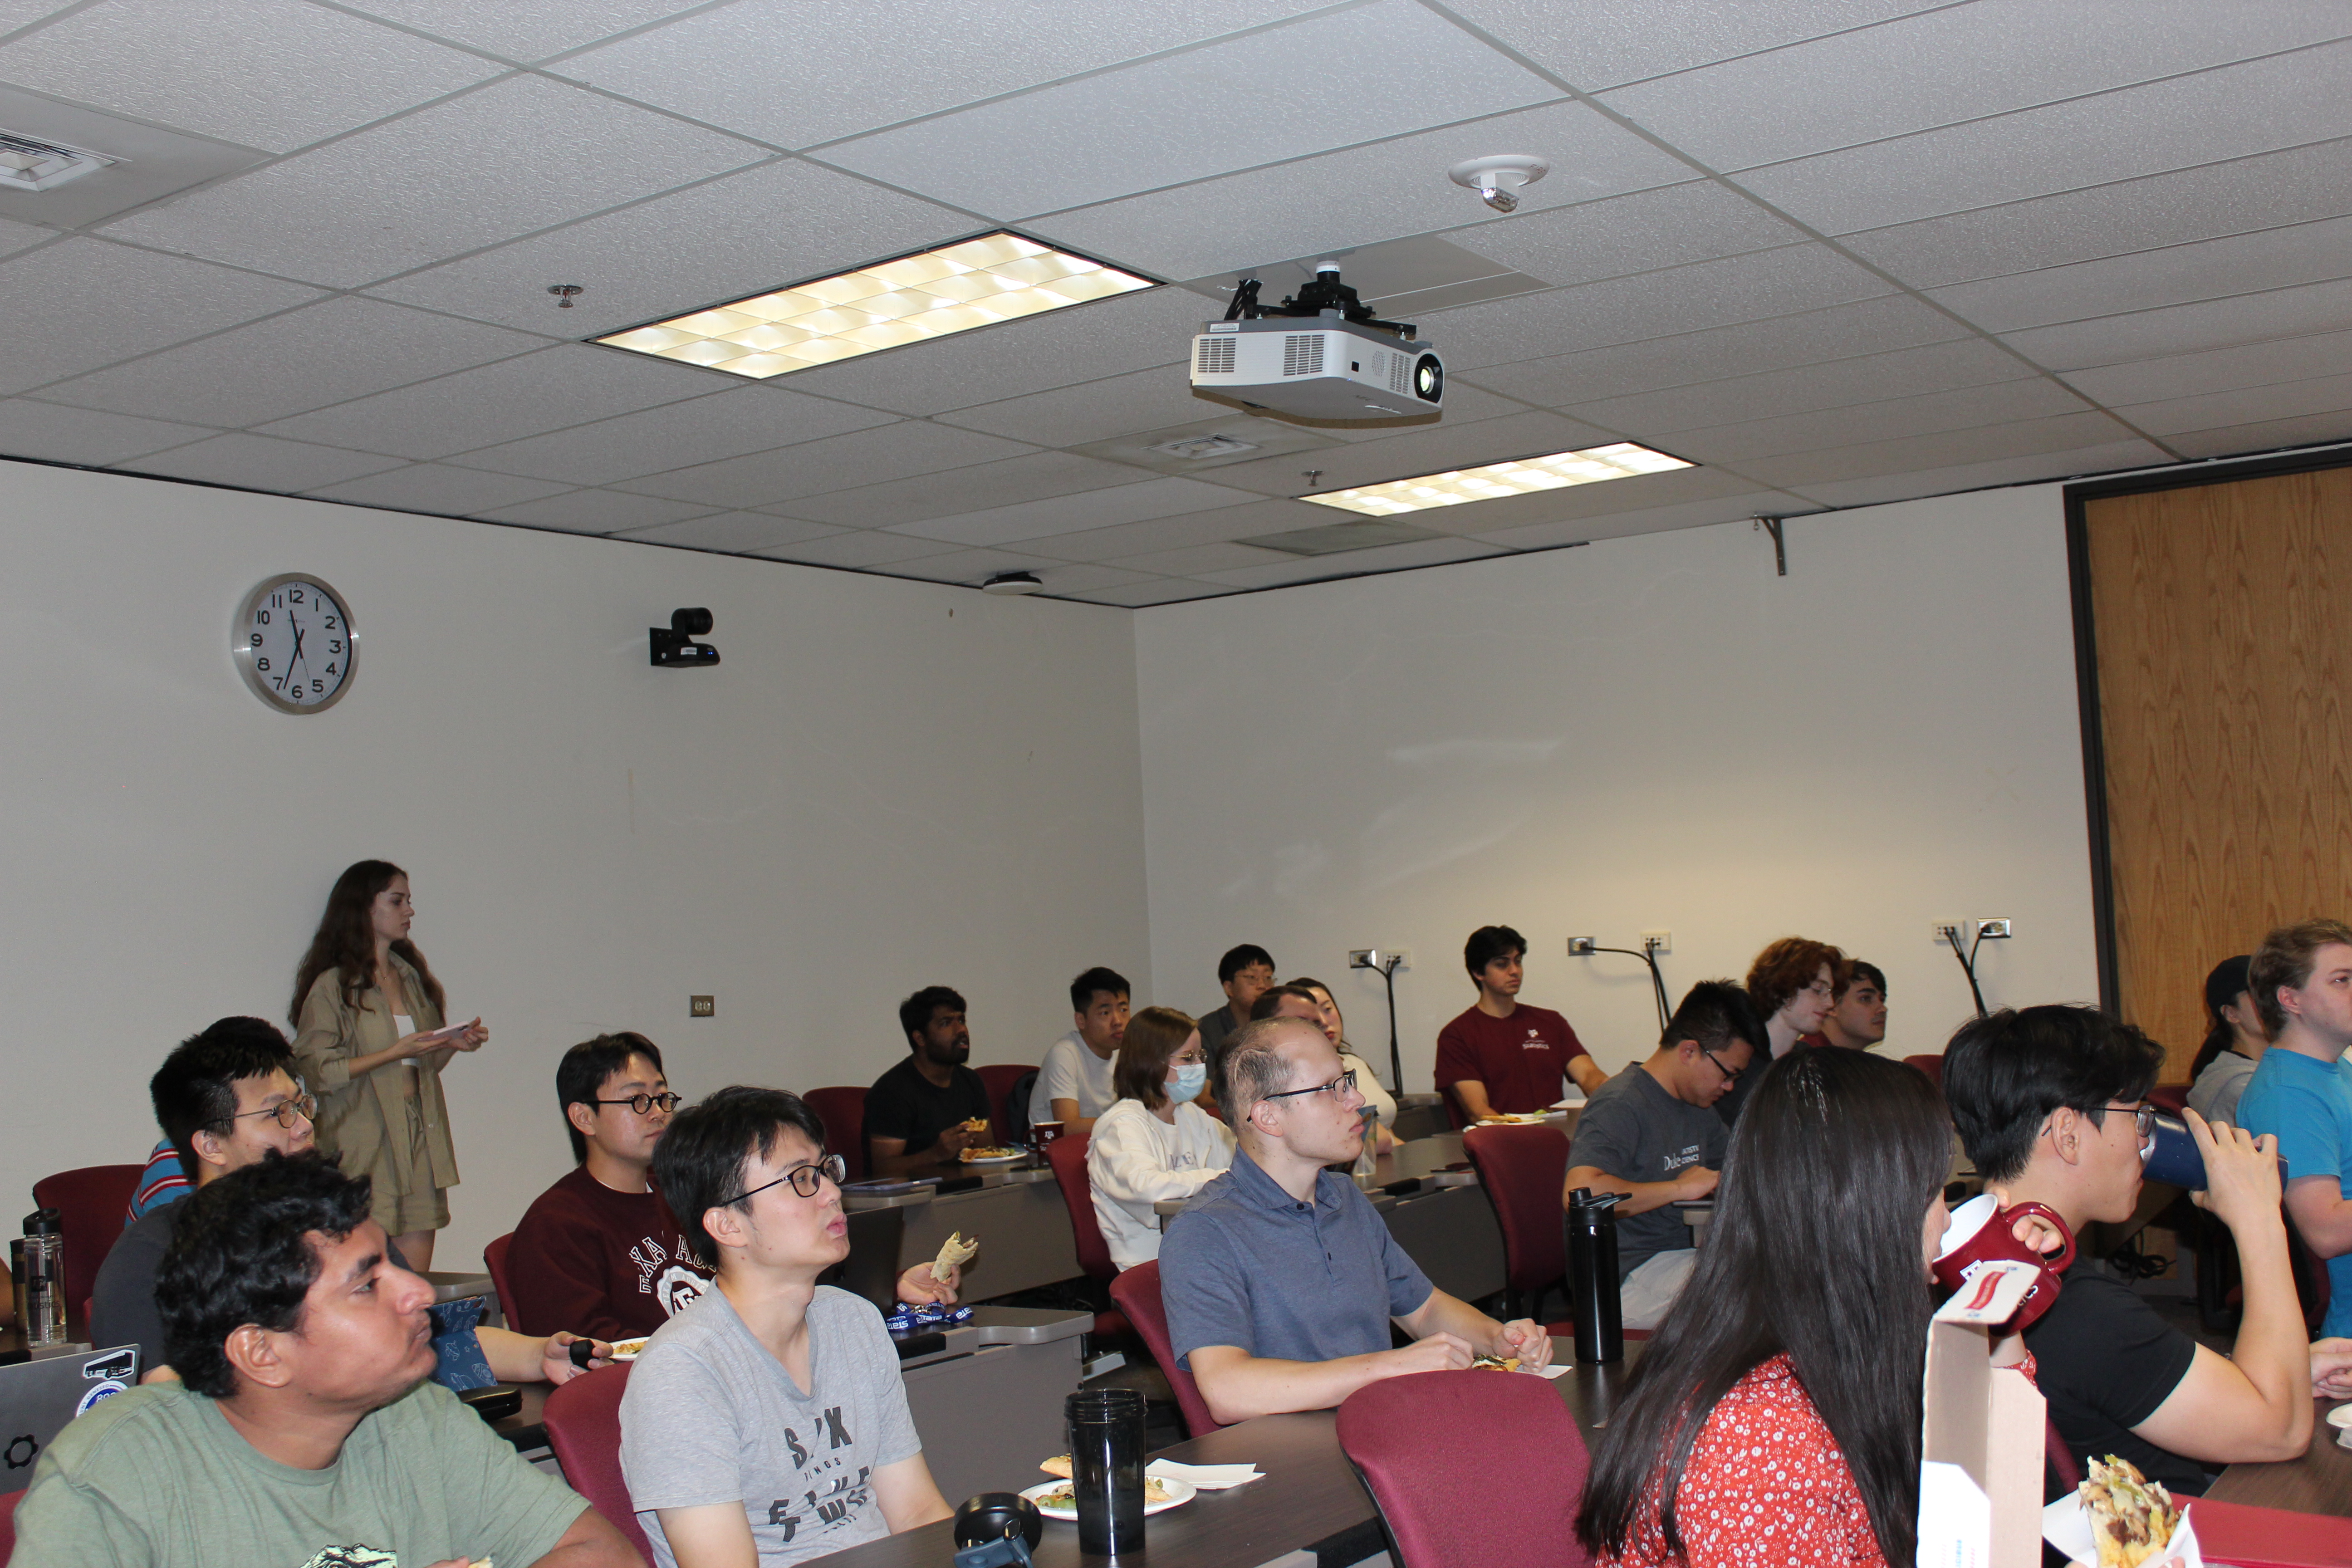
- Pizza and drinks provided
Topic
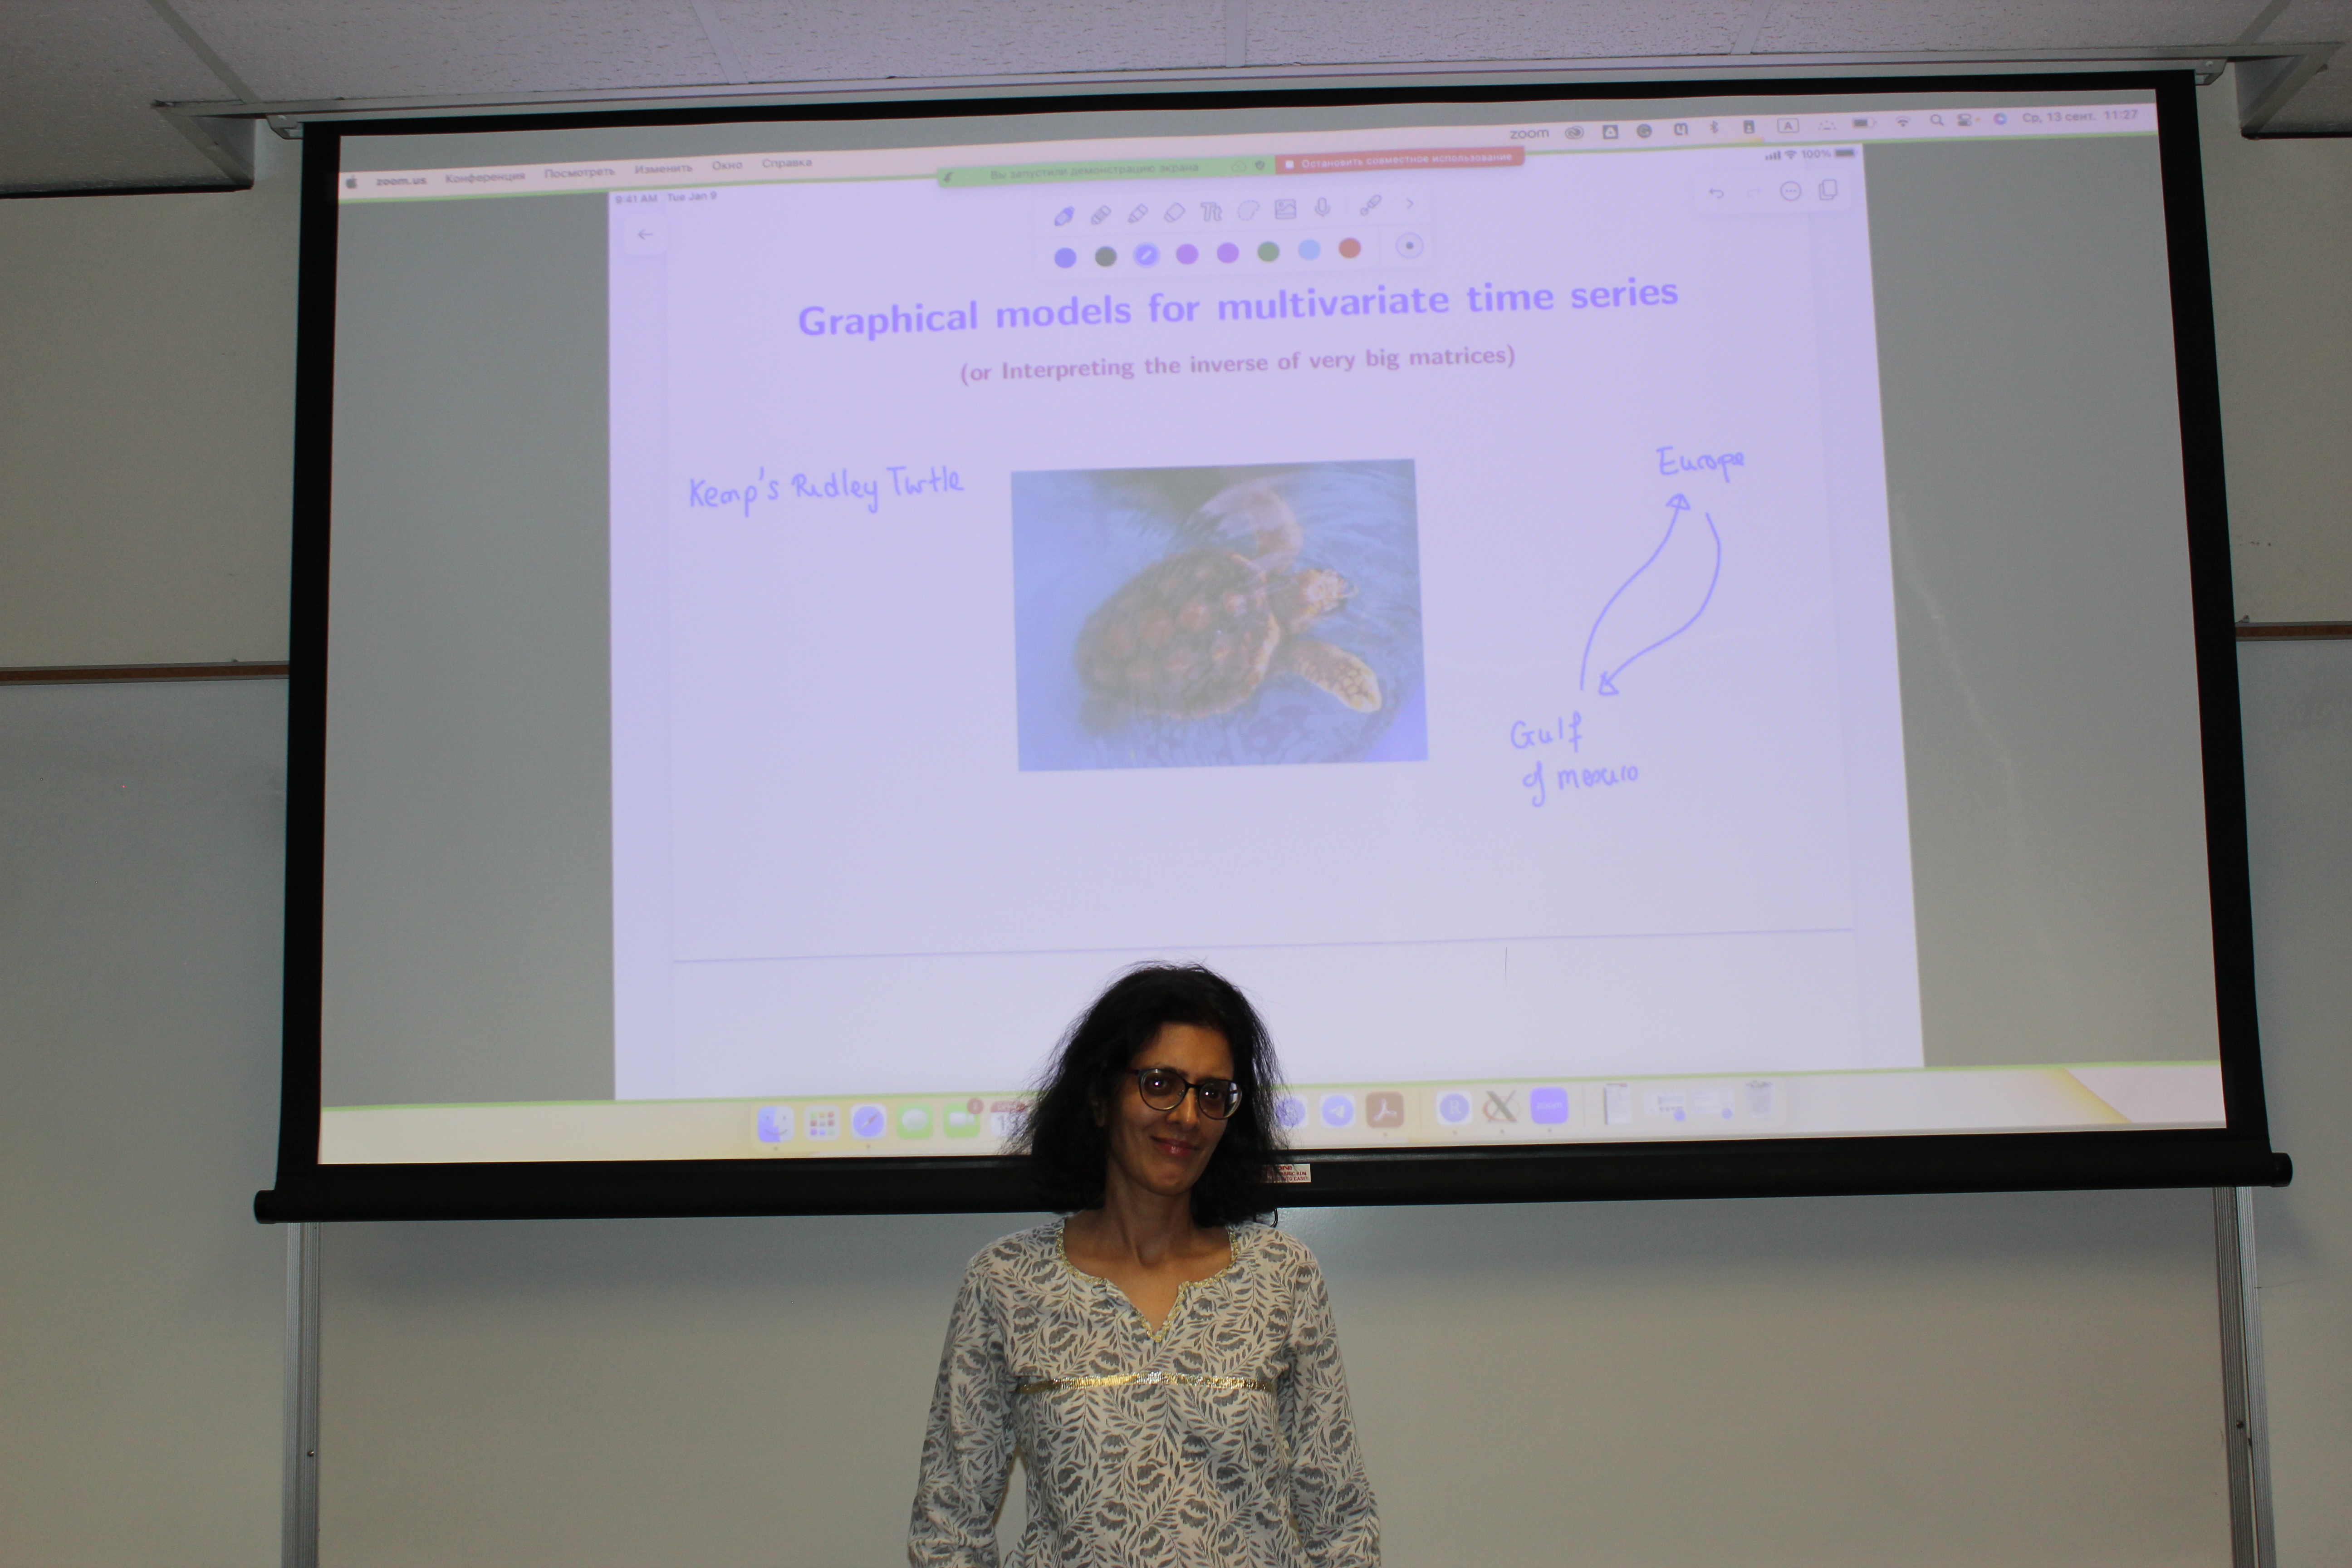
Graphical Models for Multivariate Time Series
Abstract
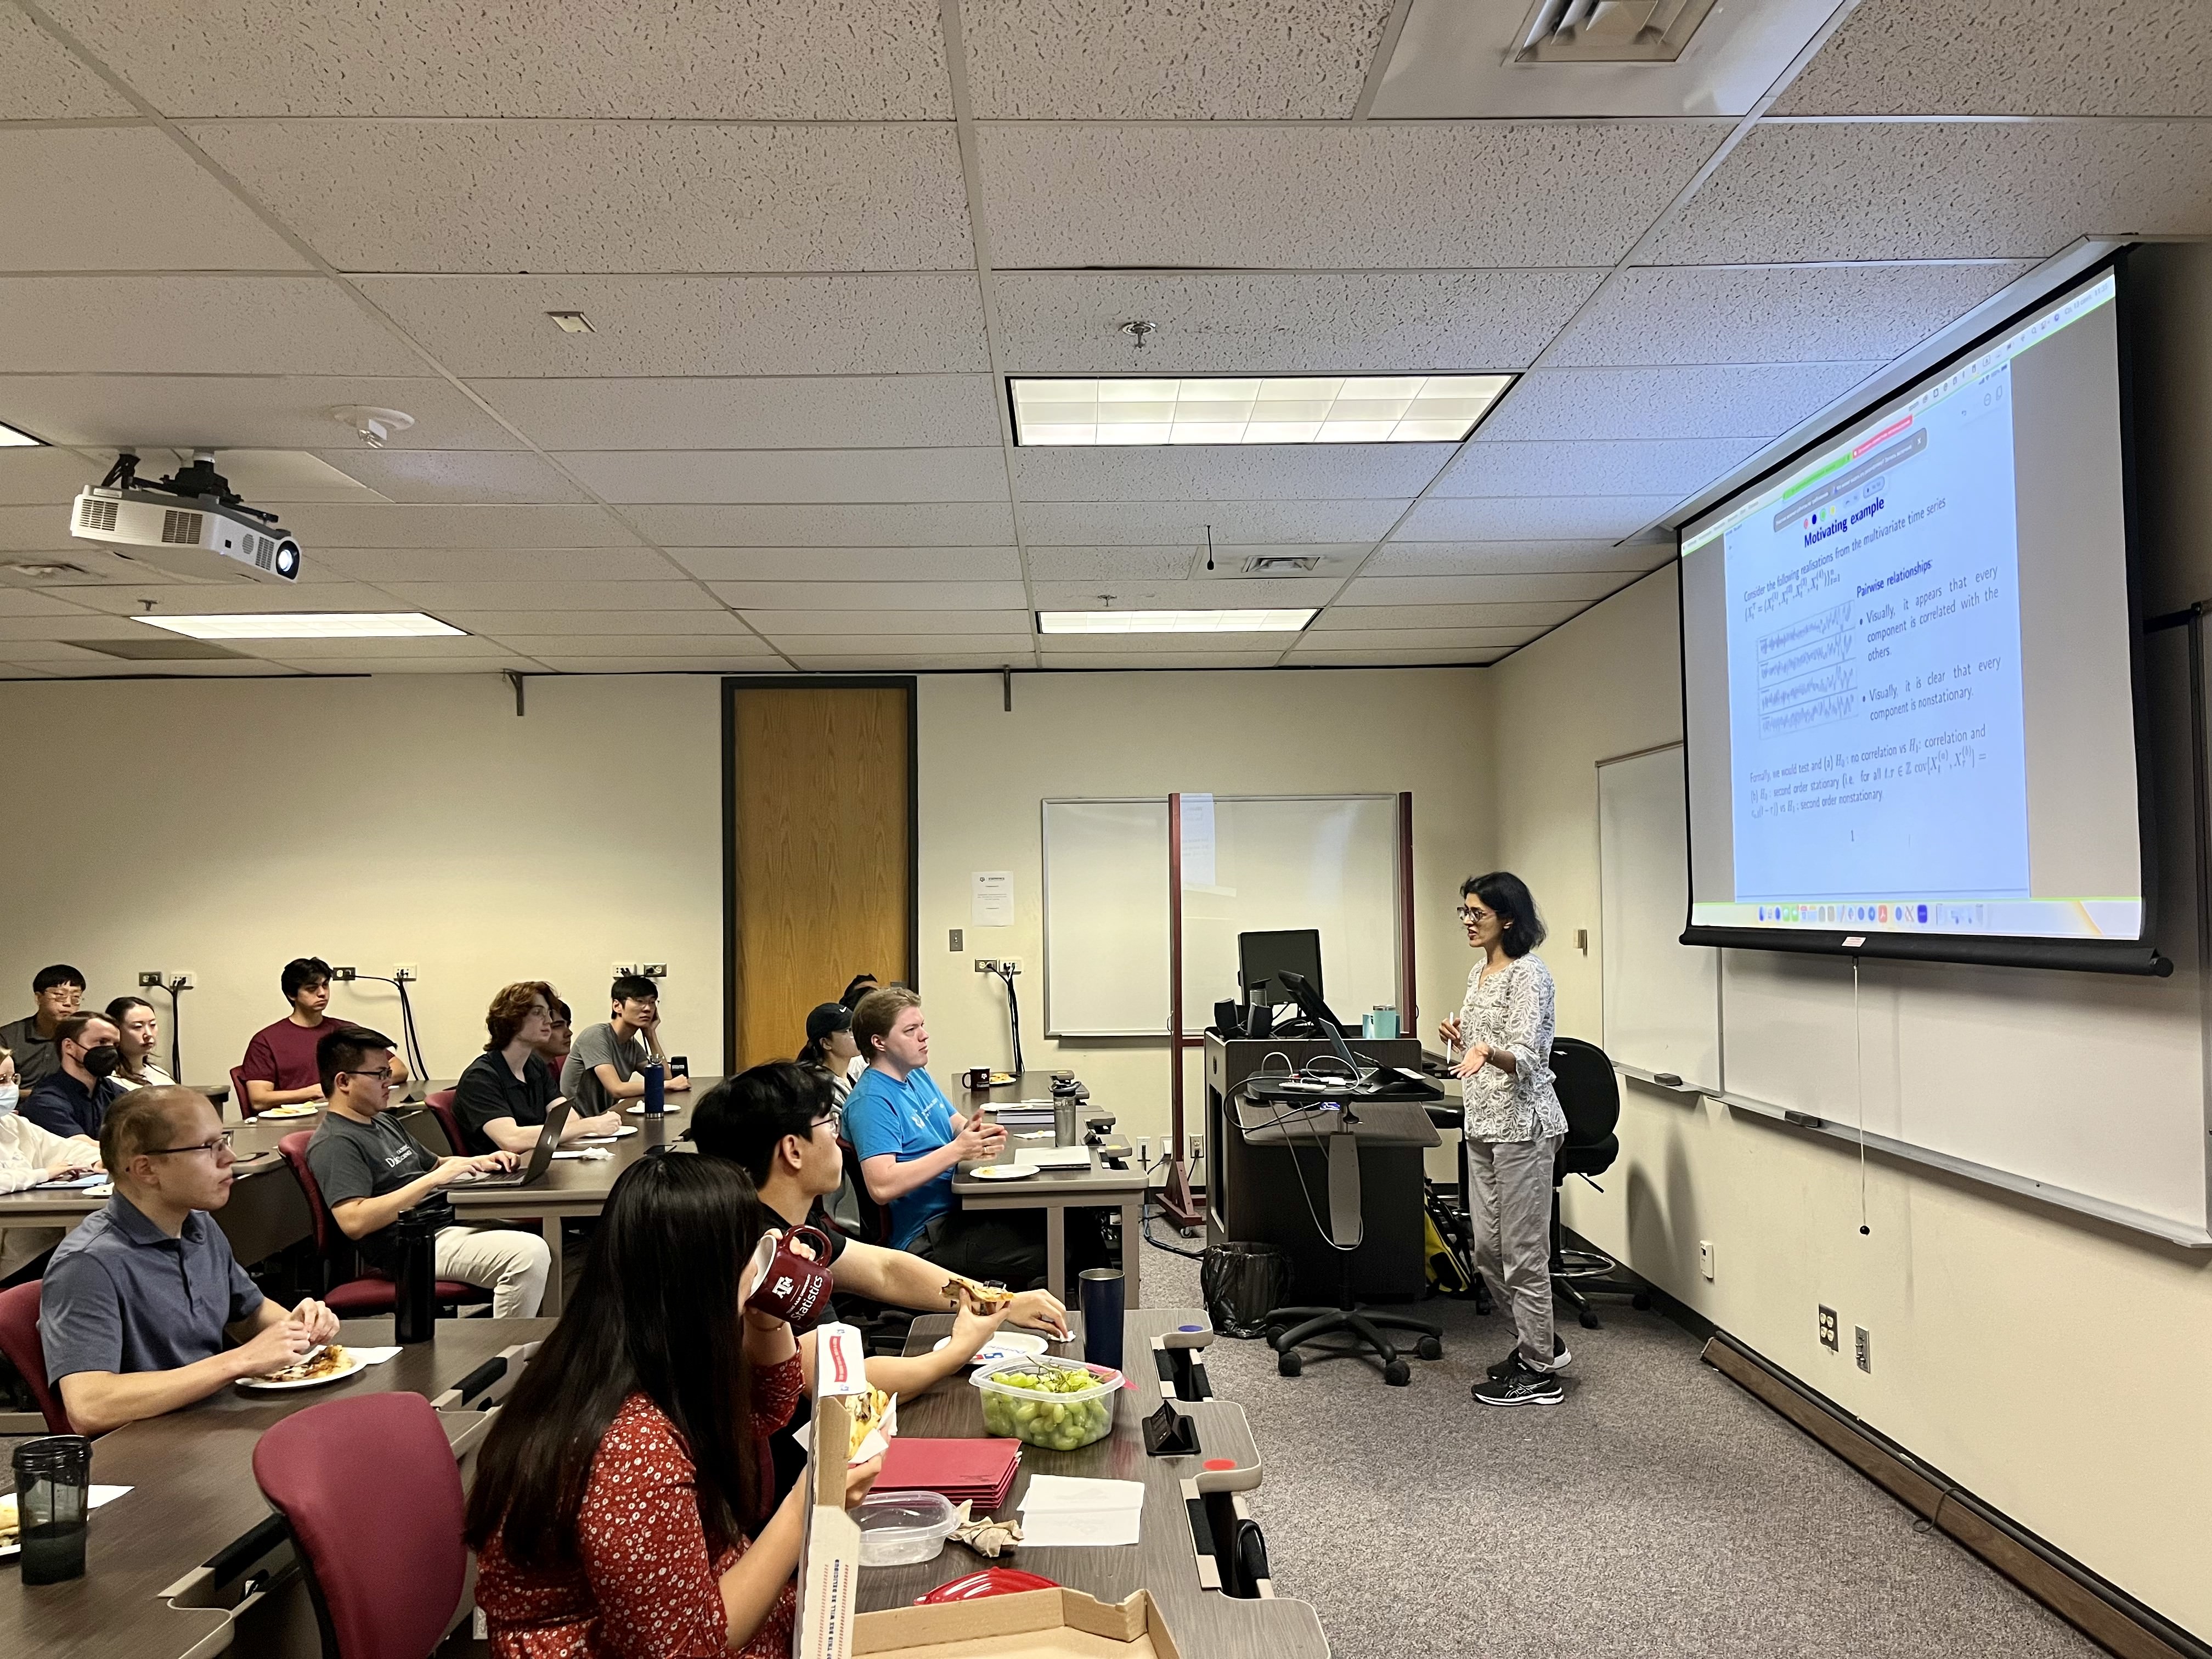
Gaussian Graphical Model (GGM) is a method for depicting conditional relationships between random variables. The inverse variance matrix, usually called the precision matrix, is the workhorse of (GGM). We start this talk by introducing the basic concepts of GGM. We then explain how the GGM framework maps over to multivariate time series. The main difference is that the matrices are extremely large (infinite dimensional) but the basic concepts remain. We show certain transformations of the time series can sparsify these “large” matrices. Finally, we conclude the talk by defining a Graphical model for Nonstationary time series. If time permits, we show estimation of the graph for nonstationary time series is possible.
Presentation
Recording
Gallery (With photos by Camila Ponce)